
Creating a pie chart in Adobe Illustrator is fast and simple with the Pie Graph Tool. Once you have made a basic chart, you can customize it in various ways.
Whether you want to change the colors, add more information, or create a 3D chart, here is all the information you need to make a unique pie chart in Adobe Illustrator.
Make sure to check the frequently asked questions if you encounter any issues.
How to Create a Pie Chart in Illustrator
- Select the Pie Graph Tool
- Add a Custom-Sized Pie Chart to the Canvas
- Add a Specific-Sized Pie Chart to the Canvas
- Add the Data to the Table
- Add a Second Chart if Needed
- Check Your Pie Charts
- Change the Segment Colors
- Customize the Colors of the Pie Chart
- Create a 3D Pie Chart
- Change the 3D Settings
- View Your Pie Charts
Select the Pie Graph Tool
In Illustrator, you don’t have to make a pie chart from scratch. The program has an intuitive Pie Graph Tool. Select the tool from the Toolbar by clicking and holding on the Column Graph Tool. The Pie Graph Tool is located in the fly-out menu.

Add a Custom-Sized Pie Chart to the Canvas
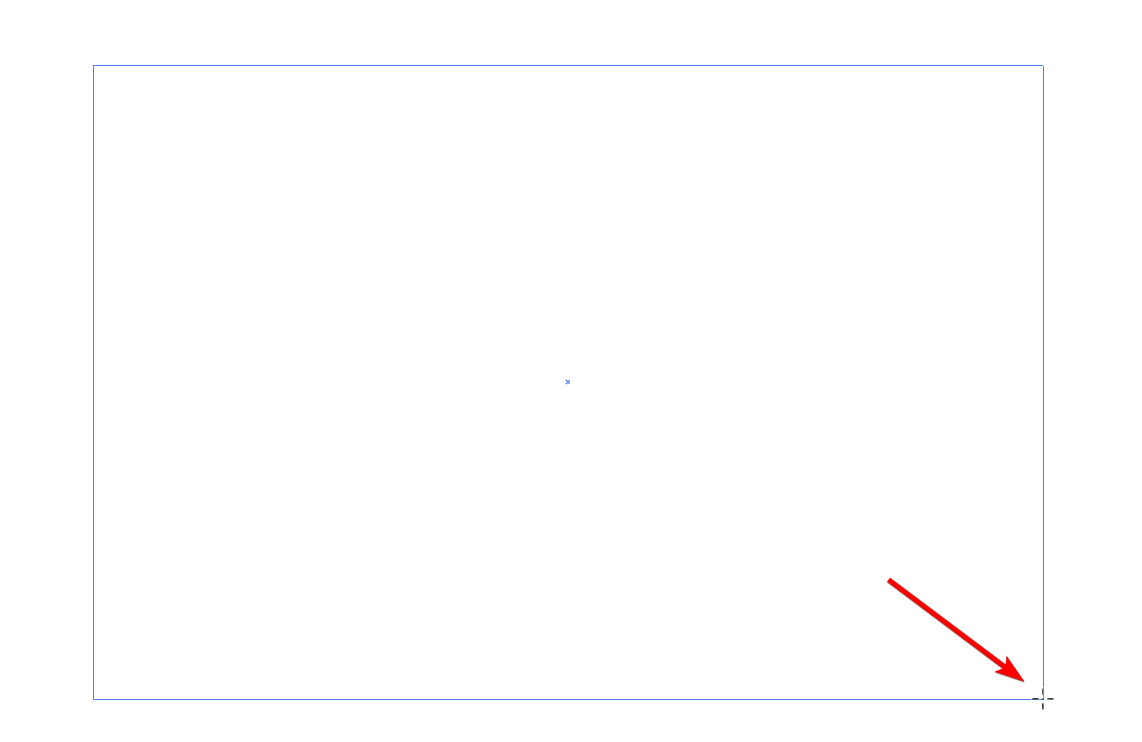
Next, add the pie chart to the canvas in one of two ways. Either click and drag out on the canvas, using the rectangle block to guide the size of the graph. When you let go, the pie chart is created.
Add a Specific-Sized Pie Chart to the Canvas
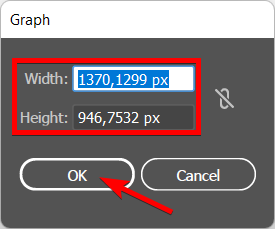
If you need the chart to be a specific size, use this method. Once the tool is active, click once on the canvas. A dialogue box opens, allowing you to add the exact size specifications for the chart.
Add the correct sizes into the Width and Height boxes and click OK.
Add the Data to the Table
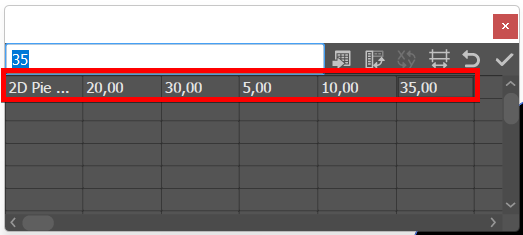
Once you’ve created the pie chart using the methods above, the chart is added to your canvas. There is also a dialogue box containing a table. You can add your pie segment amounts into these blocks.
If you want a name added below the pie graph, add it to the first block. Then add the segment percentages to the other columns. Remember to make the segments add up to 100.
Tip: If you want each segment to have a name and a legend on the side of the chart, type the names in the first row and the amounts directly below in the second row.
Add a Second Chart if Needed
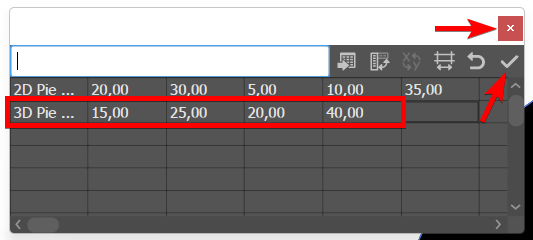
If you want to add more than one pie chart, you can easily do so in the dialogue box instead of using the tool to create another one. The two graphs will be linked if you use this method.
Add the new chart data to the second row of the table. Then click on the Checkmark when you are happy with the information and press the X icon to close the dialogue box.
Check Your Pie Charts
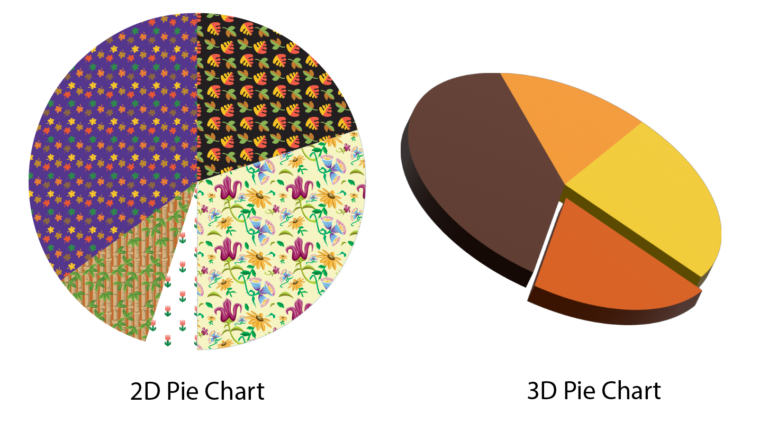
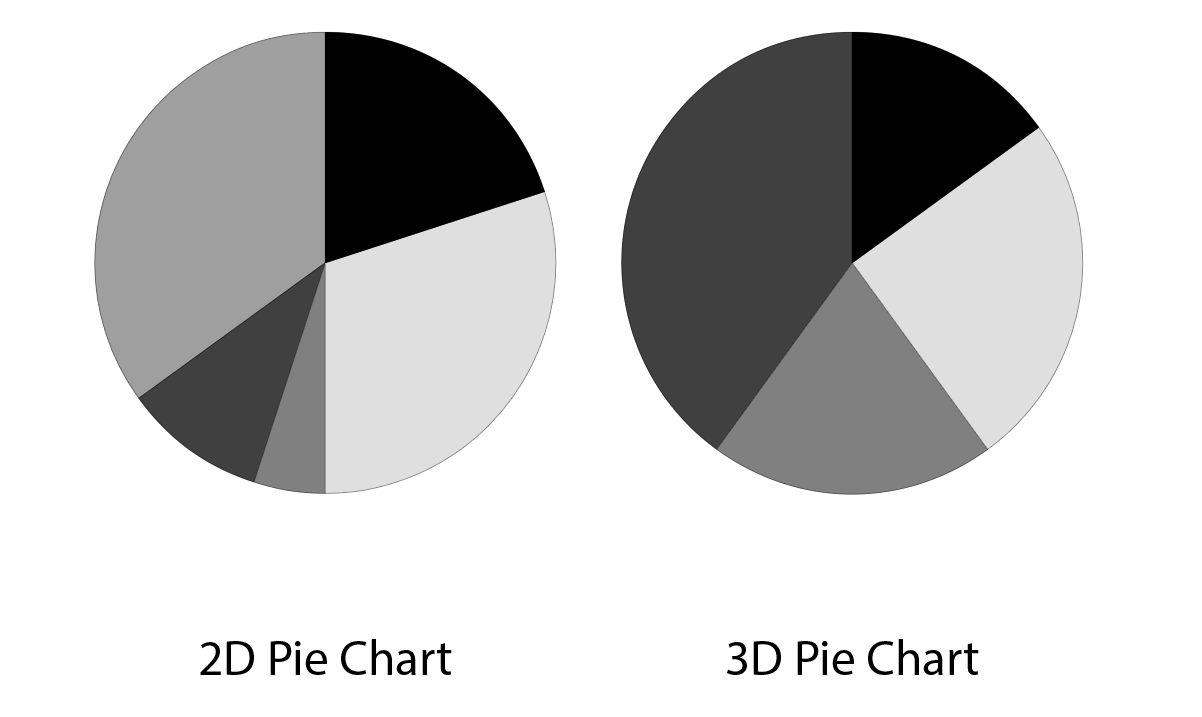
You will now have two grayscale pie charts on your canvas (or more if you add more rows). Each pie chart has a name below it (if you added names), and the segments are split how you divided them in the table.
Change the Segment Colors
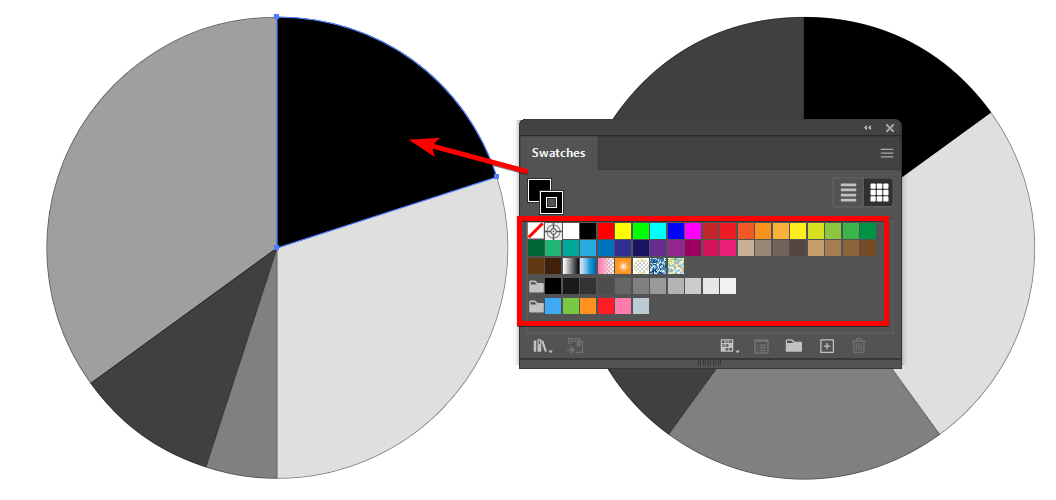
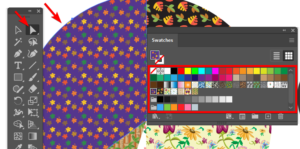
If you want to change the segment colors, use the Direct Selection Tool (A) to select a segment, then add a new color from the Color Swatch.
Customize the Colors of the Pie Chart
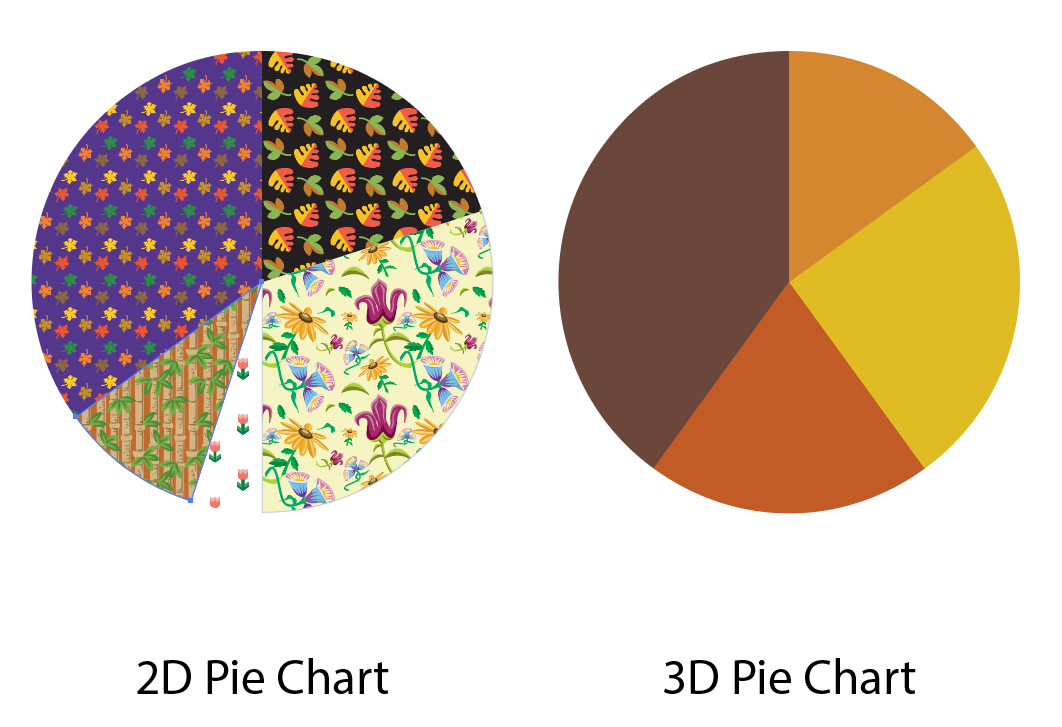
You can change each segment's colors to create a unique graph. You can add patterns or gradients to each segment using the Swatches panel.
Create a 3D Pie Chart
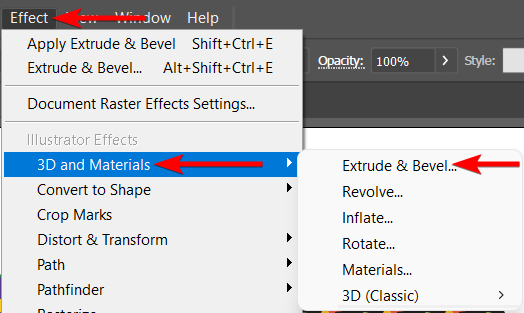
To change a pie chart to a 3D pie graph, you can add the effect and change the settings as you’d like. Select the chart you want to change, then go to the menu bar and select Effect > 3D and Materials > Extrude & Bevel.
Change the 3D Settings
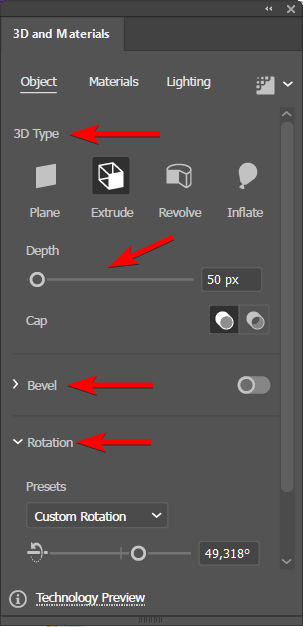
You can now alter the settings to customize the 3D effect. You can choose the 3D type you want on the chart and then change the depth. You can also rotate the chart and set a bevel. Customize the settings as you’d like to create your pie chart.
View Your Pie Charts
You now have two different pie charts. You can select segments using the Direct Selection Tool (A) and move them away from the chart if you’d like. The result is customized pie graphs that match your project.
Frequently Asked Questions
How to Resize the Pie Chart?
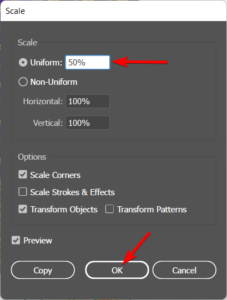
You can’t easily resize a pie chart as you do with other elements in Illustrator, but there is a workaround to resize the pie graph. Right-click on Windows or Control + click on Mac on the pie chart, then go to Transform > Scale.
In the box that opens, change the percentage next to Uniform to resize the chart. Change the amount to 50% if you want to reduce the size by half or 200% if you want to double the size. Then Click OK to resize the chart.
How to Change the color of the Pie Chart?
Use the Direct Selection Tool (A) and click on a segment of the pie chart. You can then use the swatches panel to change the color of each piece individually.
Why is my Pie Graph tool in Illustrator not working?
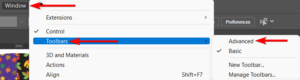
In some cases, the Pie Graph Tool doesn’t function correctly or doesn’t appear in the Toolbar. This is usually caused by a different layout or workspace used in the program. To fix this, go to Window > Toolbars > Advanced. This activates the latest Toolbar, and you can see and access the Pie Graph Tool now.
How Can I Edit My Pie Chart?
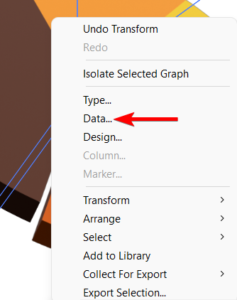
If you want to edit the data in the pie chart to change the size of the segments, you can easily open up the data dialogue box and make your changes. Right-click on Windows or Control + click on Mac on the pie graph you want to edit, and click on Data. This opens the table where you can edit the chart.
👍 Support Us: Subscribe to our channel and help us continue providing these tutorials.
🌟 Regular Updates: We publish how-to videos for Adobe Illustrator regularly!
🔧 Expert Guidance: Learn Illustrator from our professionals and uncover exclusive tips!