To create a table in Illustrator, you can use one of these two workarounds since Illustrator doesn’t have a dedicated table feature.
- Using the Rectangular Grid Tool to quickly create a set number of rows and columns that can be customized (quickest method)
- Using the Split into Grid Command, which sets each block as an individual path for more customization options (customizable method)
Here is all you need to know to add and edit your tables.
Method 1: Using the Rectangular Grid Tool
- Select the Rectangular Grid Tool
- Click once on the canvas
- Set the rows, columns, width, and height for the table
- Draw the table
- Adjust the stroke and fill of the table (optional)
- Add text to the cells (optional)
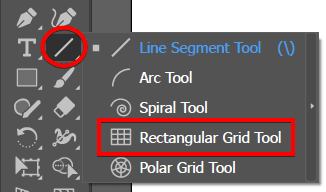
Select the Rectangular Grid Tool
Select the Rectangular Grid Tool from the toolbar. You can find it by clicking and holding the Line Segment Tool and choosing the Rectangular Grid Tool from the pop-up menu.
Click once on the canvas
Click anywhere on the artboard to open the Rectangular Grid Tool options dialog box.
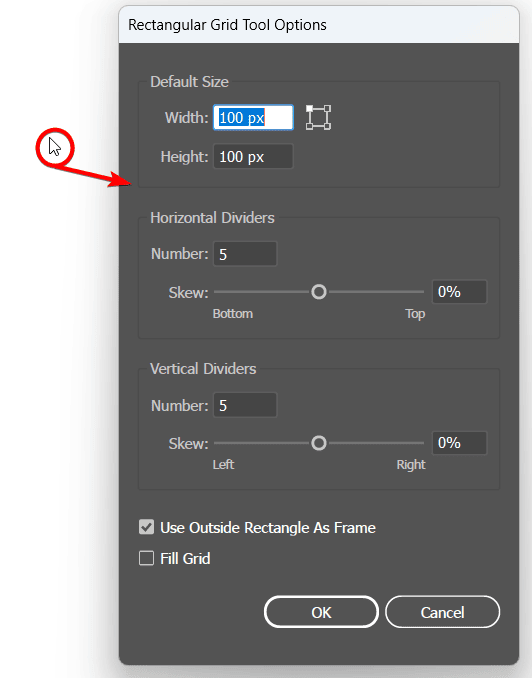
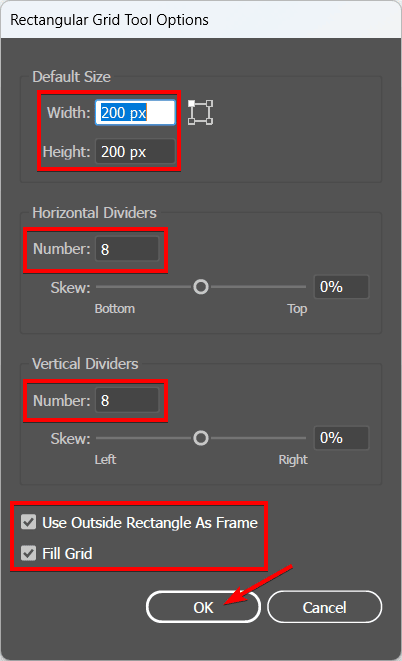
Set the rows, columns, width, and height for the table
Here, you can enter the width and height of the table and the number of horizontal and vertical dividers. You can also select whether the outside rectangle should be used as the frame and if you want to fill the table. Click OK to close the dialog box.
Remember: If you choose to Fill the Grid, it will set the table as the fill and stroke colors of whatever the swatches are in the toolbar. So, set your fill and stroke color beforehand.
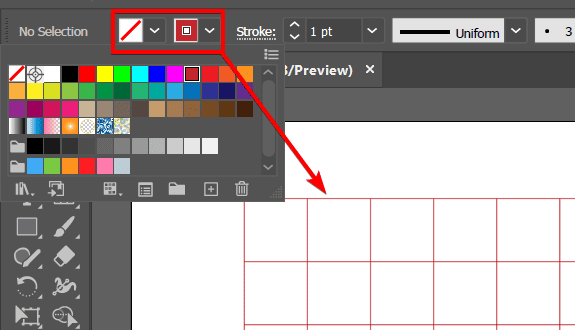
Draw the table
When you click OK, the table will appear on your canvas. You can also skip the settings dialog box and simply drag to draw the table manually and use the arrow keys to adjust the number of rows and columns while dragging.

Adjust the stroke and fill of the table (optional)
To change the stroke color and width of the table, select the table with the Selection Tool (V) and use the stroke and fill settings in the options bar to change the colors. You can also change the stroke width of the grid lines. Lastly, use the Appearance Panel (Window > Appearance) to add multiple strokes or effects to the table.
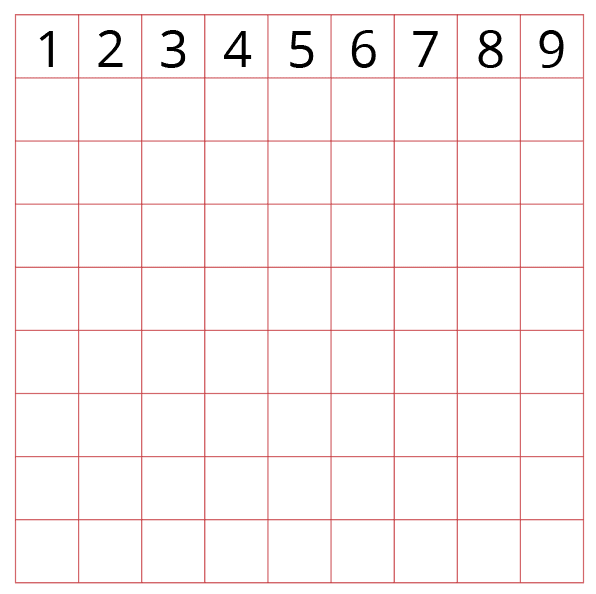
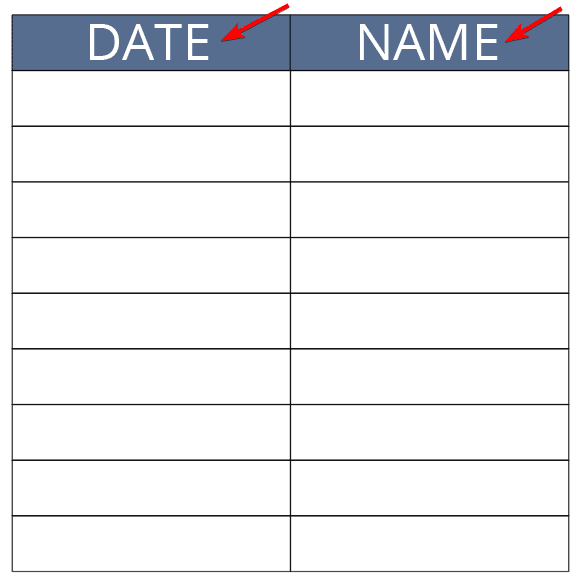
Add text to the cells (optional)
To add text to the table cells, select the Type Tool (T) and click on the artboard to create point text. You can use the Character Panel (Window > Character) and the Paragraph Panel (Window Paragraph) to change the text style and alignment.
You will then need to place the text box over the cell. Repeat and align the text as needed. You can then group the text and the table by selecting it all and pressing Control + G on Windows or Command + G on Mac.
Method 2: Using the Split Into Grid Command
- Select the Rectangle Tool, click, and drag to create the shape
- Go to Object > Path > Split Into Grid
- Enter the table attributes
- View the grid
- Change the fill and stroke color of the table (optional)
- Add text to the cells (optional)
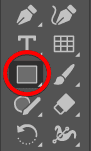
Select the Rectangle Tool, click, and drag to create the shape
Select the Rectangle Tool (M) from the toolbar and click and drag on the artboard to draw a rectangle. You can also click on the artboard to open the rectangle options dialog box and enter the width and height of the rectangle.
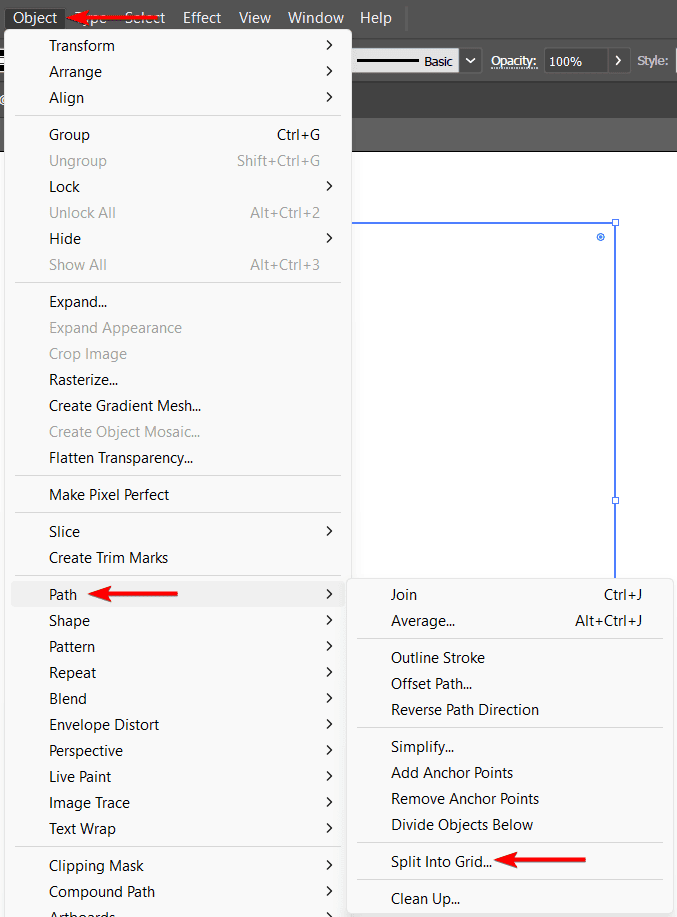
Go to Object > Path > Split Into Grid
Select the rectangle with the Selection Tool (V) and go to Object > Path > Split Into Grid. This will open the split into grid options dialog box.
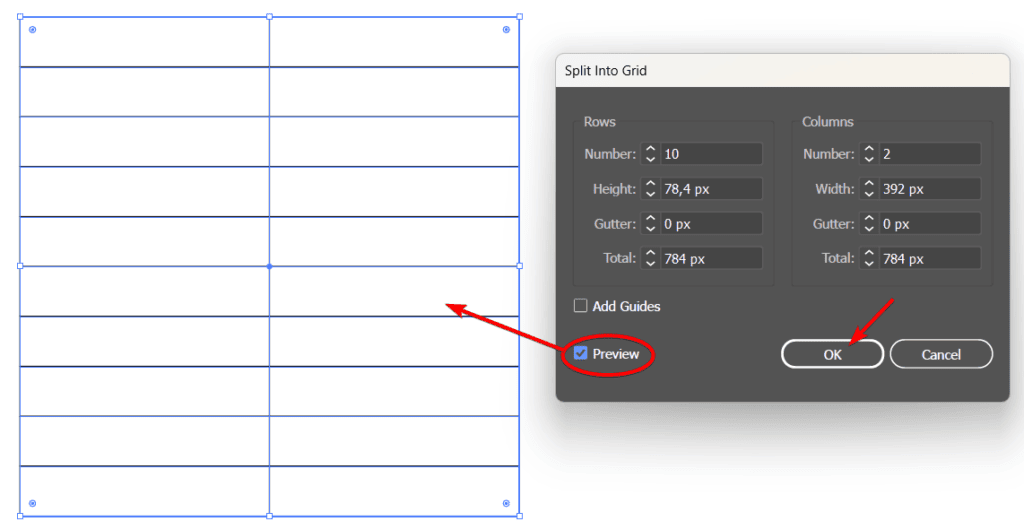
Enter the table attributes
Here, you can enter the number of rows and columns, the gutter size, and the height and width values. You can also check the preview box to see how the grid looks before applying it. Click OK to create the table.
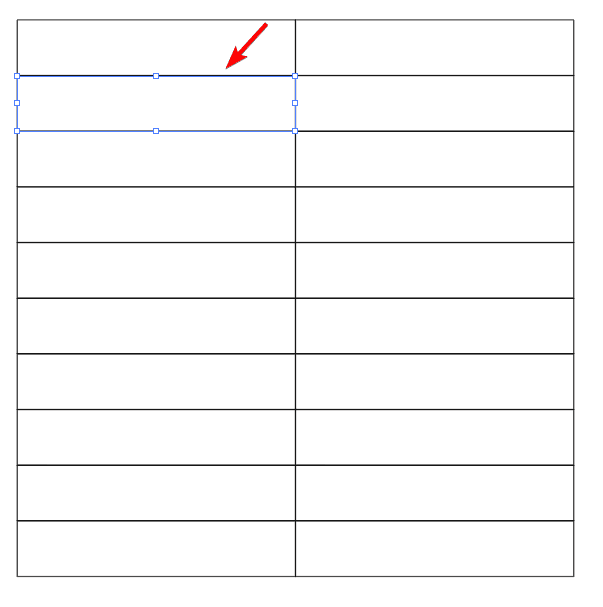
View the grid
You will see that the rectangle split into a grid and is made of separate paths that you can edit individually or as a group.
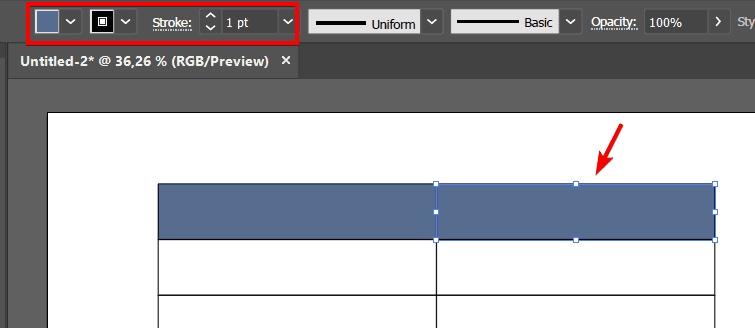
Change the fill and stroke color of the table (optional)
To change the stroke color and width of the grid, select the grid or one cell with the Selection Tool (V) and use the stroke and fill settings in the options bar to change the colors. You can also use the Appearance Panel (Window > Appearance) to add multiple strokes or effects to the grid.
Add text to the cells (optional)
You will need to add text using the same process as the first method. Select the Type Tool (T) and add a text box to type into. Then, place the text box over the cell where you want the text. Repeat and align the text as needed. Lastly, group the text and the table by pressing Control + G on Windows or Command + G on Mac.
👍 Support Us: Subscribe to our channel and help us continue providing these tutorials.
🌟 Regular Updates: We publish how-to videos for Adobe Illustrator regularly!
🔧 Expert Guidance: Learn Illustrator from our professionals and uncover exclusive tips!